
One of the varieties of features that Microsoft PowerPoint offers is to help people present some information through graphics, charts, clip arts, and slideshow effects. One such feature is that of creating a Timeline. Timeline allows presenters to use tools and create a presentation with a standard timeline showcasing the progress of developing a project.
Timeline allows for presenting editable slides depicting how a working team is progressing over a given project or task over the period. Using Timeline tools, these slides become aesthetic and comprehensive for all people on the team.
Read More: How to Embed YouTube Videos in PowerPoint
Here’s how you can create a Timeline on Microsoft PowerPoint:
Creating a Timeline on MS PowerPoint Presentations
Step 1: Open a PowerPoint slide.
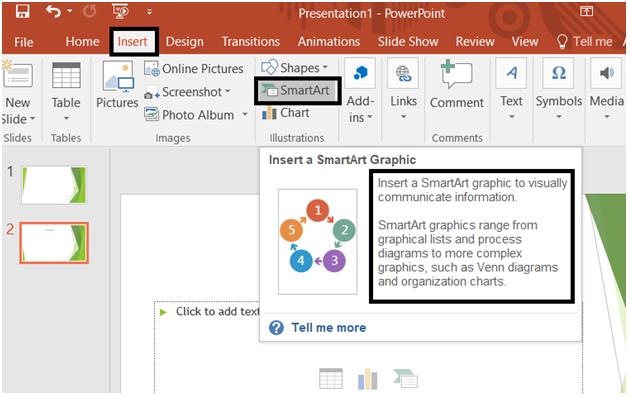
Step 2: Head to Insert menu on the taskbar.
Step 3: From the Insert tab, navigate and find the option for SmartArt. It will be in between the options for 3D Models and Chart.
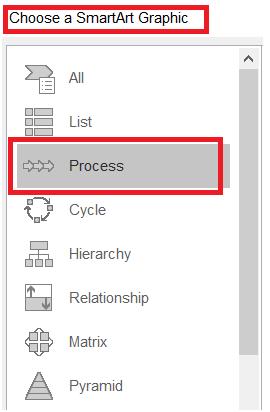
Step 4: A list of SmartArt Graphics will appear in a table titled – Choose a SmartArt Graphic.
Step 5: From the list in SmartArt Graphics table, select – Process.
Step 6: A new window showcasing some process-based SmartArt graphics will appear. A process is defined by several sequential steps with the progress shown over directional arrows. Hence, all the SmartArt graphics will be in the form of different structural arrows.
Step 7: Here, we’ll choose the Basic Timeline option.
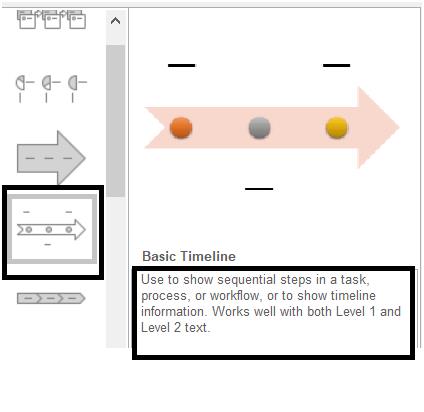
Step 8: There will be a small pop-up display giving out the information on the selected SmartArt Graphics option.
Step 9: Click OK to begin.
Step 10: Now, the chosen SmartArt graphic can be seen on the slide. You can also notice a small window where the user can type the text.
Step 11: You can type the text for the three bullets on the timeline arrow. Each bullet will represent a task in a coordinated sequence.
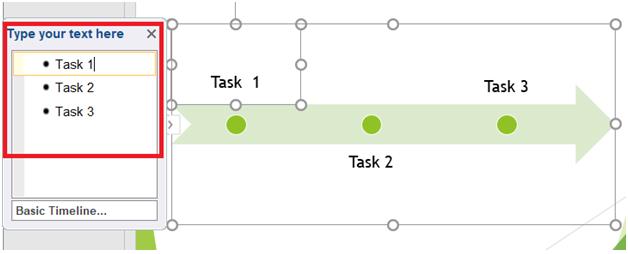
Step 12: In case a sequence has more than three tasks, you can increase the number of bullets. Just press Enter after completing the text for the third bullet. Repeat this step again and again to get more bullets.
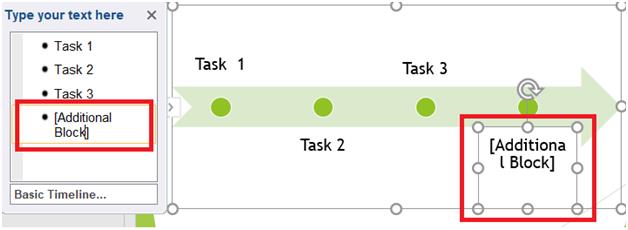
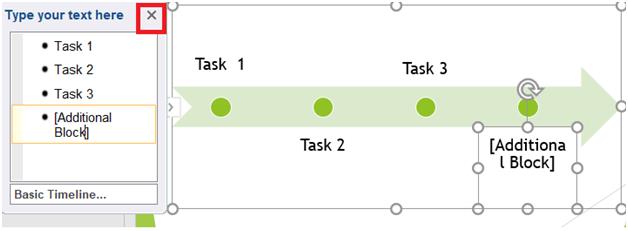
Step 13: The size of the text is adjusted automatically. Once you are done with the text, click on the Cross (X) button at the top right of the window you were using to write the text.
Step 14: You can drag the text block to edit the sequence whenever you want (optional step).
Your SmartArt Graphic is now complete, and a proper Timeline is created. You can further add a new SmartArt Graphic and extend the timeline as soon as you get forward with the progress.
Change Colors of Timeline Graphic on Microsoft Presentation
Step 1: Select the Timeline graphic.
Step 2: In the taskbar, click on Design.
Step 3: Under the tab, click on Change Colors menu.
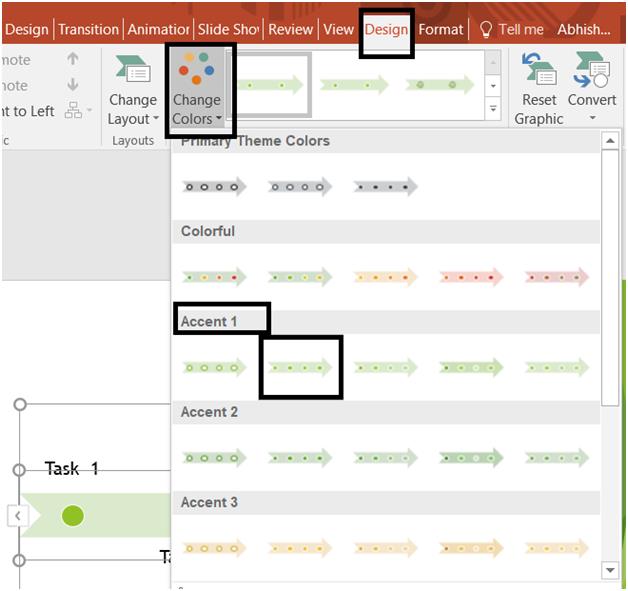
Step 4: A drop-down menu will appear from where you can select plenty of color schemes for your Timeline graphics.
Step 5: Every color scheme will have different accent groups; you can choose a color from those schemes.
Edit Timeline Graphic Text
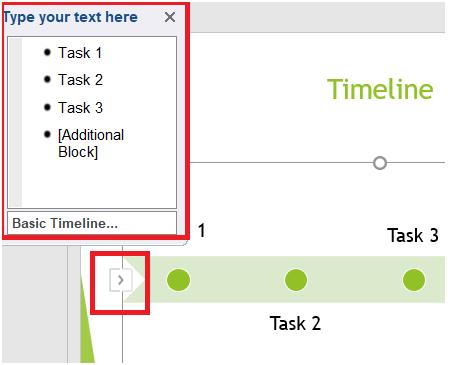
All you need to do is click on the Left-Arrow Icon at the left corner of the Timeline graphic. This will reopen the Timeline Text Editor box, where you can type new text, or edit the previously written text, thus updating the entire graphic.
This way, you’ll be able to create a perfect timeline chart for presenting a progress report over an assigned assignment or for a specific work project.
You May Also Like
Top 4 PPT To Video Converter Software For Windows And Mac
Best Alternatives to MS PowerPoint
How to Add Videos in PowerPoint Versions 2007, 2010, 2013, 2016